[ML] 3-4. 평가 - ROC 곡선과 AUC
ROC 곡선
ROC(Receiver Operation Characteristic Curve)는 수신자 판단곡선이라고 불리는데 이는 2차대전 때 통신 장비 성능 평가를 위해 고안된 수치이다. 일반적으로 의학 분야에서 많이 사용되지만, 머신러닝의 이진 분류 모델의 예측 성능을 판단하는데 중요한 평가 지표
FPR(False Positive Rate, X축)가 변할 때 TPR(True Positive Rate, Y축)이 어떻게 변하는지를 나타내는 곡선
FPR = $ FP \over (FP + TN) $ = $ 1 - TNR$ = 1 - 특이성
TPR = 재현율 = $ TP \over (FN + TP)$
입력 파라미터
y_true : 실제 클래스 값 array
y_score : predict_proba()의 반환 값 arrayd에서 Positive 예측 확률
반환 값
fpr : fpr 값을 array로 반환
tpr : trp 값을 array로 반환
thresholds : threshold 값 array
import pandas as pd
import numpy as np
from sklearn.model_selection import train_test_split
from sklearn.linear_model import LogisticRegression
from sklearn.datasets import load_breast_cancer

cancer = load_breast_cancer()
X_train, X_test, y_train, y_test = train_test_split(cancer.data, cancer.target, test_size = 0.2, random_state=120)

lr_clf = LogisticRegression()

lr_clf.fit(X_train, y_train)
pred = lr_clf.predict(X_test)
from sklearn.metrics import roc_curve

# 레이블 값이 1일때의 예측 확률을 추출
pred_proba_class1 = lr_clf.predict_proba(X_test)[:, 1]

fprs, tprs, thresholds = roc_curve(y_test, pred_proba_class1)
# 반환된 임계값 배열에서 샘플로 데이터를 추출하되, 임계값을 5 step으로 추출
# thresholds[0]은 max(예측확률)+1로 임의 설정됨. 이를 제외하기 위해 np.arnage는 1부터 시작
thr_index = np.arange(1, thresholds.shape[0], 5)
print('샘플 추출을 위한 임계값 배열의 index:', thr_index)
print('샘플 index로 추출한 임계값: ', np.round(thresholds[thr_index], 2))

# 5 step 단위로 추출된 임계값에 따른 FPR, TPR 값
print('샘플 임계값별 FPR: ', np.round(fprs[thr_index], 3))
print('샘플 임계값별 TPR: ', np.round(tprs[thr_index], 3))
샘플 추출을 위한 임계값 배열의 index: [ 1  6 11]
샘플 index로 추출한 임계값:  [1.   0.86 0.43]
샘플 임계값별 FPR:  [0.    0.047 0.14 ]
샘플 임계값별 TPR:  [0.014 0.887 0.972]
import matplotlib.pyplot as plt
def roc_curve_plot(y_test, pred_proba_c1):
# 입계값에 따른 FPR, TPR 값을 반환받음.
fprs, tprs, threholds = roc_curve(y_test, pred_proba_c1)
# ROC 곡선을 그래프 곡선으로 그림.
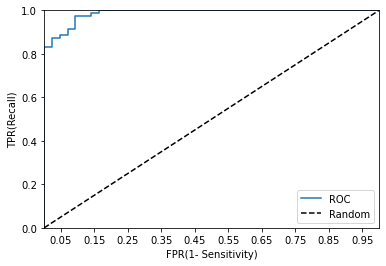
plt.plot(fprs, tprs, label='ROC')
# 가운데 대각선 직선을 그림.
plt.plot([0, 1], [0, 1], 'k--', label='Random')
# FPR X 축의 Scale을 0.1 단위로 변경, X, Y축 명 설정 등
start, end = plt.xlim()
plt.xticks(np.round(np.arange(start, end, 0.1), 2))
plt.xlim(0, 1)
plt.ylim(0, 1)
plt.xlabel('FPR(1- Sensitivity)')
plt.ylabel('TPR(Recall)')
plt.legend()
pred_proba = lr_clf.predict_proba(X_test)
roc_curve_plot(y_test, pred_proba[:, 1])
from sklearn.metrics import roc_auc_score

pred_proba = lr_clf.predict_proba(X_test)[:, 1]
roc_score = roc_auc_score(y_test, pred_proba)
print('ROC AUC 값: {0:.4f}'.format(roc_score))
ROC AUC 값: 0.9869
Comments